We’ve all experienced a delayed flight whilst traveling at some point, and whilst this is usually completely out of your control, it doesn’t make it any less frustrating.
Flying with kids can be difficult enough at the best of times, especially if traveling with a baby or toddler, but lengthy delays can make an already stressful journey even more so.
But, perhaps surprisingly, you’re more likely to experience delays at some airports and on some airlines than others, and to find out which these are, we’ve taken a deep-dive into the Bureau of Transportation Statistics’s (BTS) ‘Airline On-Time Statistics and Delay Causes‘ data.
Keep reading to find out which airlines and airports are most likely to face delays based on two years’ data from July 2019 to July 2021.
The US Airports Where Your Flight is Most Likely to be Delayed or Cancelled
When traveling within the US, you’re more likely to be delayed when flying into some airports than others.
Having sight of delay statistics ahead of traveling can, at the very least, help you to set expectations and understand the chance that your flight is going to arrive later than planned.
At one airport, almost 1 in 4 flights arrives later than its scheduled time, with the top ten rankings on airport delays having at least a 1 in 5 chance of a delay.
Here are the airports where flight arrivals are most frequently delayed:
| Rank | Airport | State | % On Time | % Late or Cancelled |
|---|---|---|---|---|
| 1 | Newark Liberty International | NJ | 75.71% | 24.29% |
| 2 | LaGuardia | NY | 77.48% | 22.52% |
| 3 | Dallas/Fort Worth International | TX | 79.23% | 20.77% |
| 4 | Fort Lauderdale-Hollywood International | FL | 79.78% | 20.22% |
| 5 | Palm Beach International | FL | 80.34% | 19.66% |
| 6= | Boston Logan International | MA | 80.61% | 19.39% |
| 6= | Louis Armstrong New Orleans International | LA | 80.61% | 19.39% |
| 8 | Orlando International | FL | 80.78% | 19.22% |
| 9 | San Antonio International | TX | 80.97% | 19.03% |
| 10= | John F. Kennedy International | NY | 81.21% | 18.79% |
| 10= | San Francisco International | CA | 81.21% | 18.79% |
/cdn.vox-cdn.com/uploads/chorus_image/image/59135801/newark1.0.jpg)
Newark Liberty International Airport takes the top spot as the airport that faced the highest number of delayed arrivals between July 2019 and July 2021; with a total of 24.29% of flights running behind schedule.
The US Airports Where Your Flight is Least Likely to be Delayed
On the other hand, the chance of your flight being delayed can almost halve when flying into other airports across the country.
Here are the airports where flight arrivals are least frequently delayed:
| Rank | Airport | State | % On Time | % Late or Cancelled |
|---|---|---|---|---|
| 50 | Daniel K Inouye International | HI | 88.31% | 11.69% |
| 49 | Hartsfield-Jackson Atlanta International | GA | 87.32% | 12.68% |
| 48 | Minneapolis-St Paul International | MN | 87.27% | 12.73% |
| 47 | Salt Lake City International | UT | 87.22% | 12.78% |
| 46 | Detroit Metro Wayne County | MI | 86.90% | 13.10% |
| 45 | Norman Y. Mineta San Jose International | CA | 85.70% | 14.30% |
| 44 | Portland International | OR | 85.23% | 14.77% |
| 43 | John Wayne Airport-Orange County | CA | 85.12% | 14.88% |
| 42 | Sacramento International | CA | 84.95% | 15.05% |
| 41 | Metropolitan Oakland International | CA | 84.90% | 15.10% |
| 40 | Charlotte Douglas International | NC | 84.66% | 15.34% |

Daniel K Inouye International in Honolulu, Hawaii, takes the top spot as the airport that faced the fewest delayed arrivals between July 2019 and July 2021; with just 11.69% of flights running behind schedule.
Which US Airlines is Your Flight Most Likely to be Delayed With?
Just as some airports are more likely to experience delays than others, your choice of airline can also impact the chance of a late arrival.
It perhaps comes as no surprise that the three airlines with the highest percentage of late arrivals are all low-cost carriers.
Here are the airlines whose flights are most frequently delayed:
| Rank | Airline | % On Time | % Late or Cancelled |
|---|---|---|---|
| 1 | Allegiant Air | 72.69% | 27.31% |
| 2 | JetBlue Airways | 76.80% | 23.20% |
| 3 | Frontier Airlines | 78.76% | 21.24% |
| 4 | Envoy Air | 80.48% | 19.52% |
| 5 | United Airlines | 81.40% | 18.60% |
| 6 | American Airlines | 81.45% | 18.55% |
| 7 | Spirit Airlines | 82.04% | 17.96% |
| 8 | Southwest Airlines | 83.03% | 16.97% |
| 9 | Alaska Airlines | 83.18% | 16.82% |
| 10 | SkyWest Airlines | 84.01% | 15.99% |
| 11 | Republic Airline | 84.27% | 15.73% |
| 12 | Delta Airlines | 86.69% | 13.31% |
| 13 | Hawaiian Airlines | 89.00% | 11.00% |

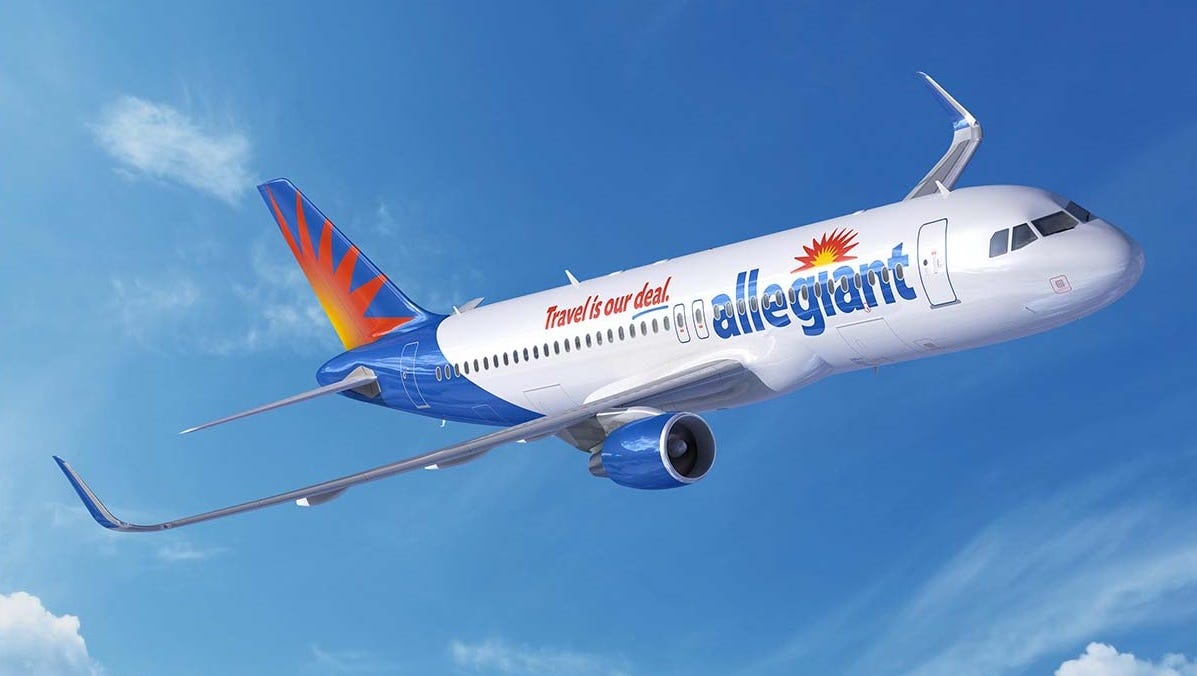
Allegiant Air faced the highest percentage of delayed flights between July 2019 and July 2021; with a total of 27.31% of flights running behind schedule.
Are you looking for an airline where kids fly free? We have a comprehensive guide that we are constantly updating with information about which airlines kids fly free. To make your booking experience even smoother, we also have a list of the best flight booking sites to make sure your flight booking experience is not met with turbulence.
Methodology
We analyzed the Bureau of Transportation Statistics’s (BTS) ‘Airline On-Time Statistics and Delay Causes‘ data for the period of July 2019 to July 2021 to obtain the percentage of on-time flight arrivals for both the USA’s 50 busiest airports and the USA’s 13 major mainline passenger and regional passenger airlines.
According to BTS data, a flight is considered delayed when it arrived 15 or more minutes later than the schedule.
More about our TFVG Author
A seasoned traveller, Dad, and avid sports tourist, James foundered The Family Vacation Guide to share his expert vacation experiences- especially when it comes to being a travelling family man.
Featured in Travel articles such as Travel + Leisure, TripSavvy and SFGate, you know you're reading some of the best vacation tips online.


